Architecture Overview
Our multimodal framework combines numerical and visual understanding
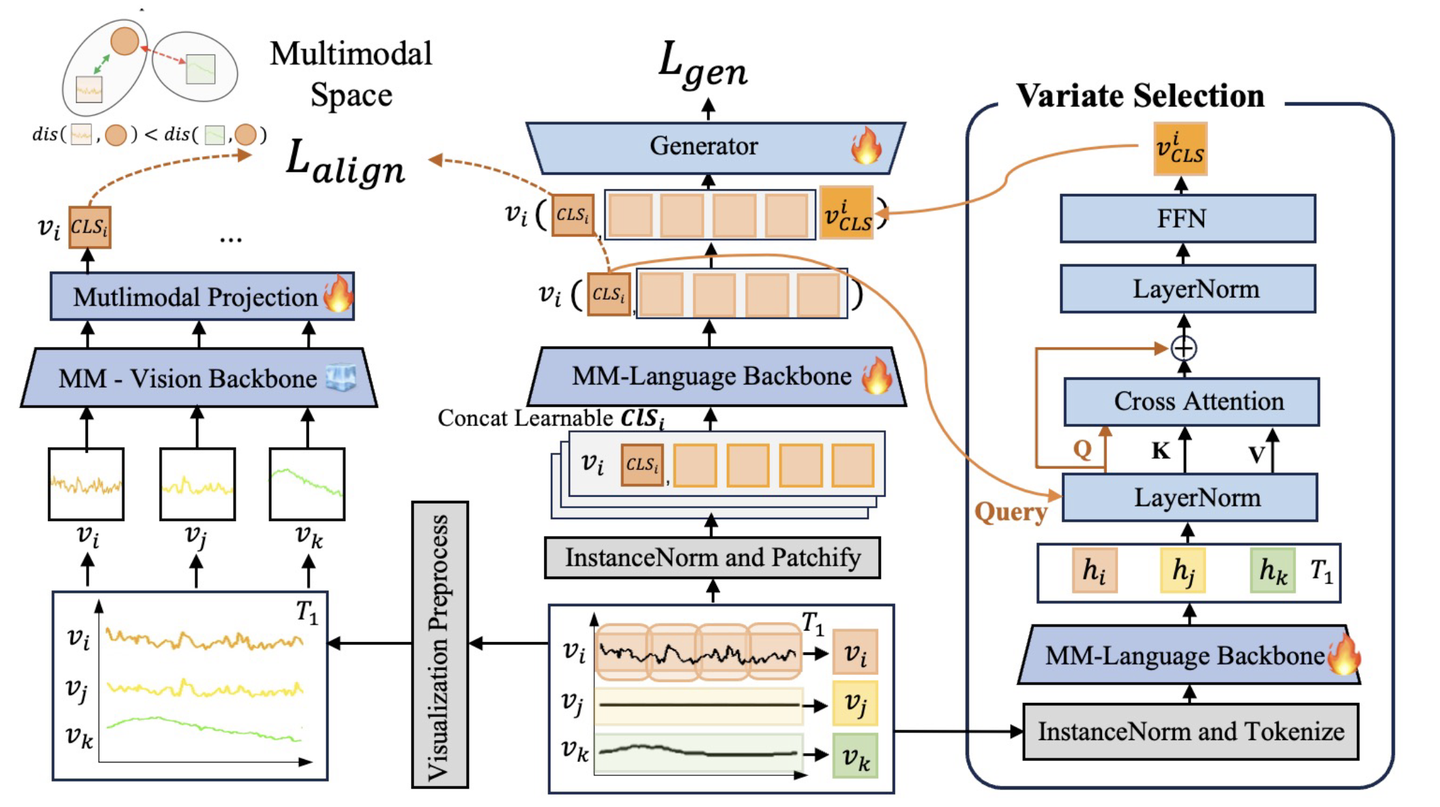
TimesCLIP architecture: Bridging numerical time series data with visual patterns through contrastive learning
Teaching Time Series to See and Speak
🚀 CLIP is ALL you NEED for Time Series Forecasting
We introduce TimesCLIP, a novel multimodal approach that bridges numerical and visual understanding in time series forecasting. By leveraging CLIP's pretrained text encoder as a backbone and incorporating visual patterns through contrastive learning, our method achieves state-of-the-art performance across 16 short-term forecasting datasets.
Our key insight is that CLIP-Text aligns multimodal space and captures both numerical and visual patterns in time series data, eliminating the need for complex architectural modifications while maintaining the scalability that makes Transformers powerful.
The framework follows a simple principle: CLIP is ALL you NEED - just replace those painfully-tuned transformer layers with CLIP-TEXT and achieve better performance with zero hyperparameter tuning.
Our multimodal framework combines numerical and visual understanding
TimesCLIP architecture: Bridging numerical time series data with visual patterns through contrastive learning
State-of-the-art performance across multiple benchmarks
16 short-term + 6 long-term forecasting benchmarks evaluated
Average improvement across 16 benchmarks vs. existing methods
Hyperparameters needed - CLIP backbone handles everything
How humans and our model see time series patterns
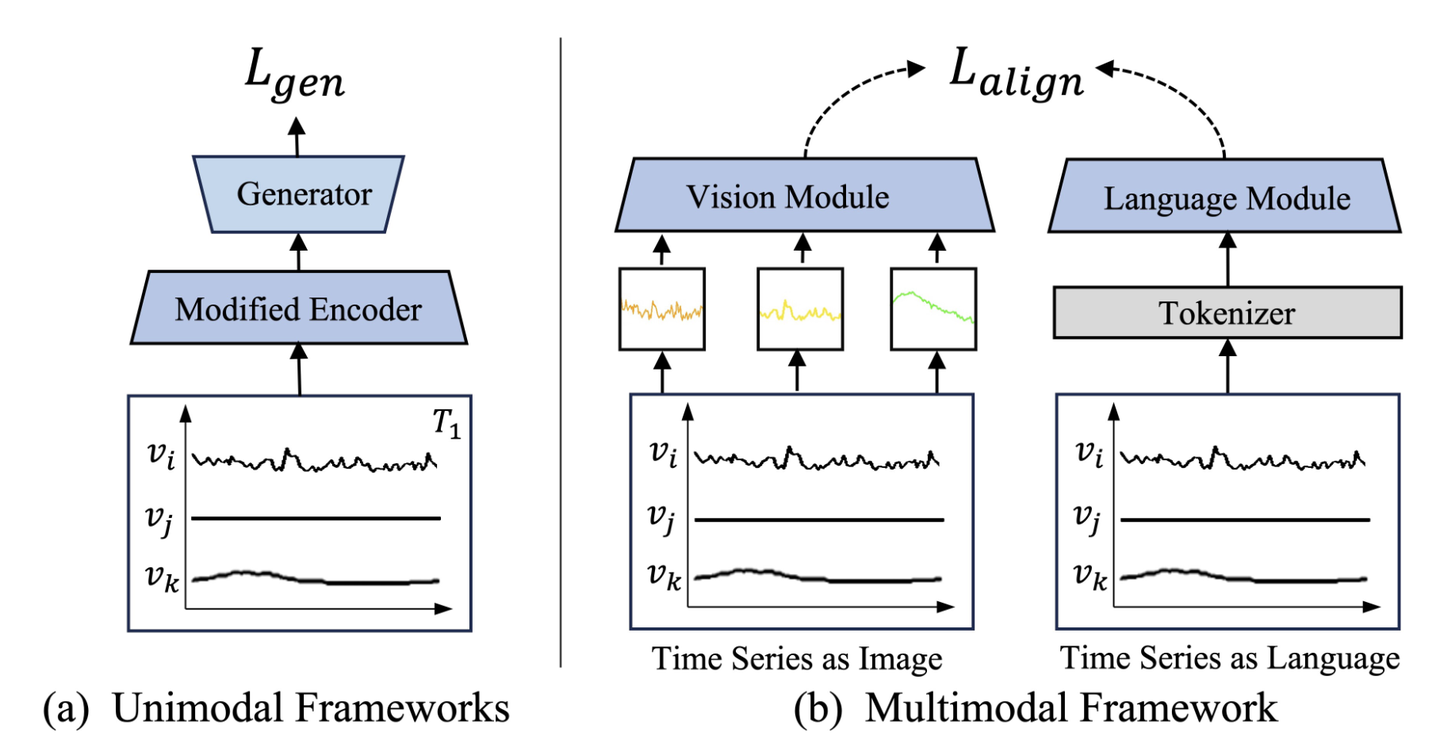
Figure 1: Comparison of existing methods vs. our multimodal approach - bridging numerical and visual understanding
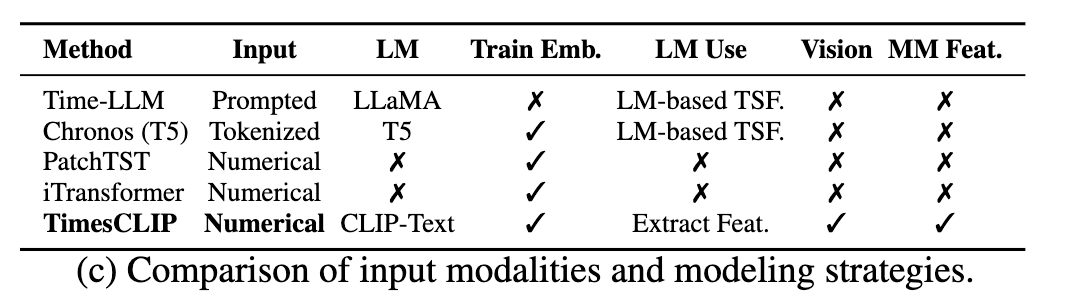
Figure 2: Comparison of existing methods vs. our multimodal approach - bridging numerical and visual understanding
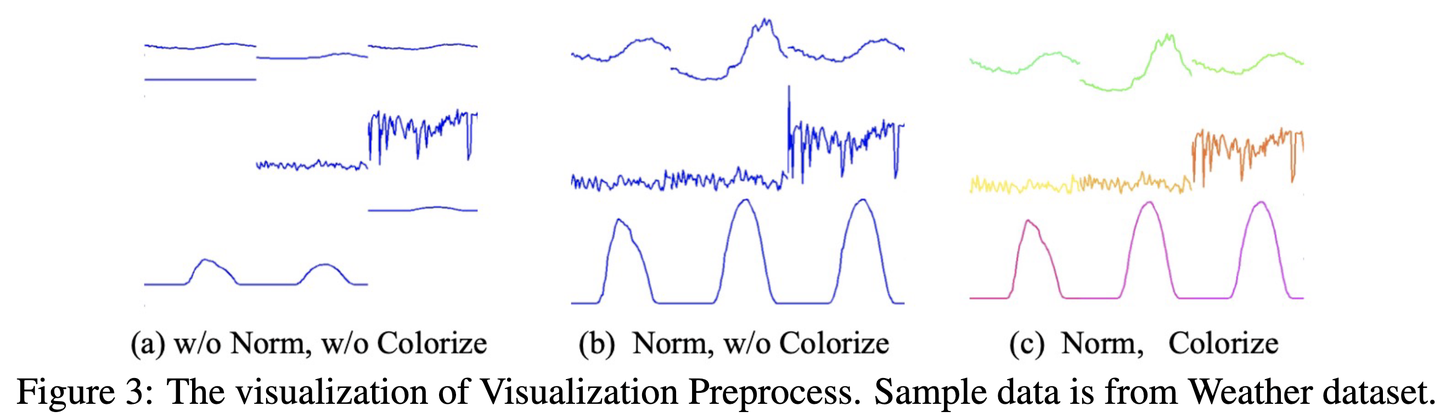
Figure 4: Visualization of time series to image conversion with different colors for each variable

Figure 5: Comprehensive comparison with state-of-the-art methods
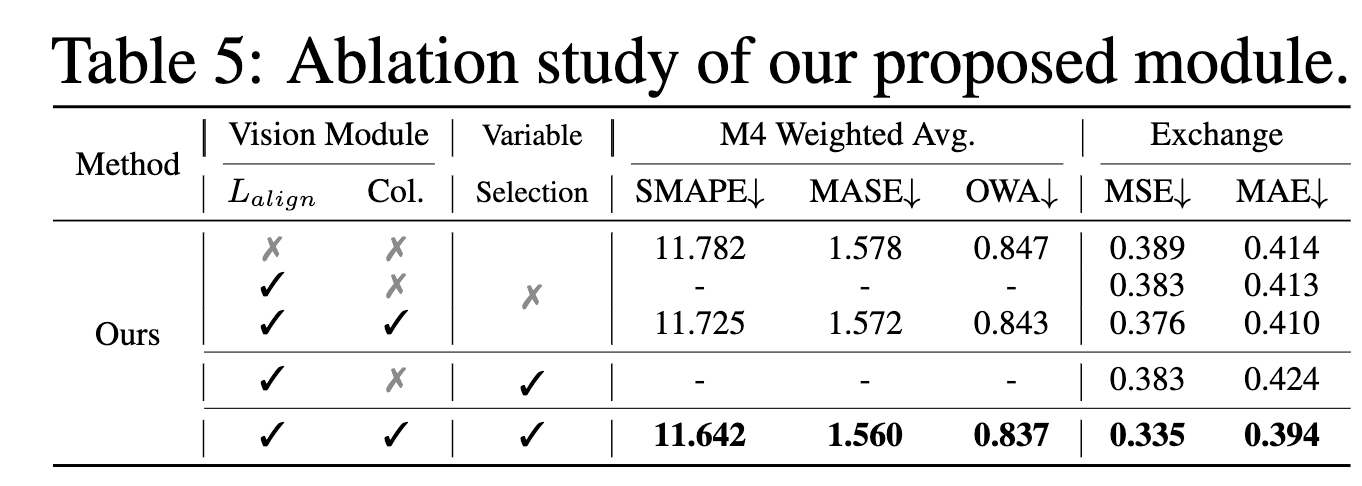
Figure 6: Ablation study results showing the impact of different components
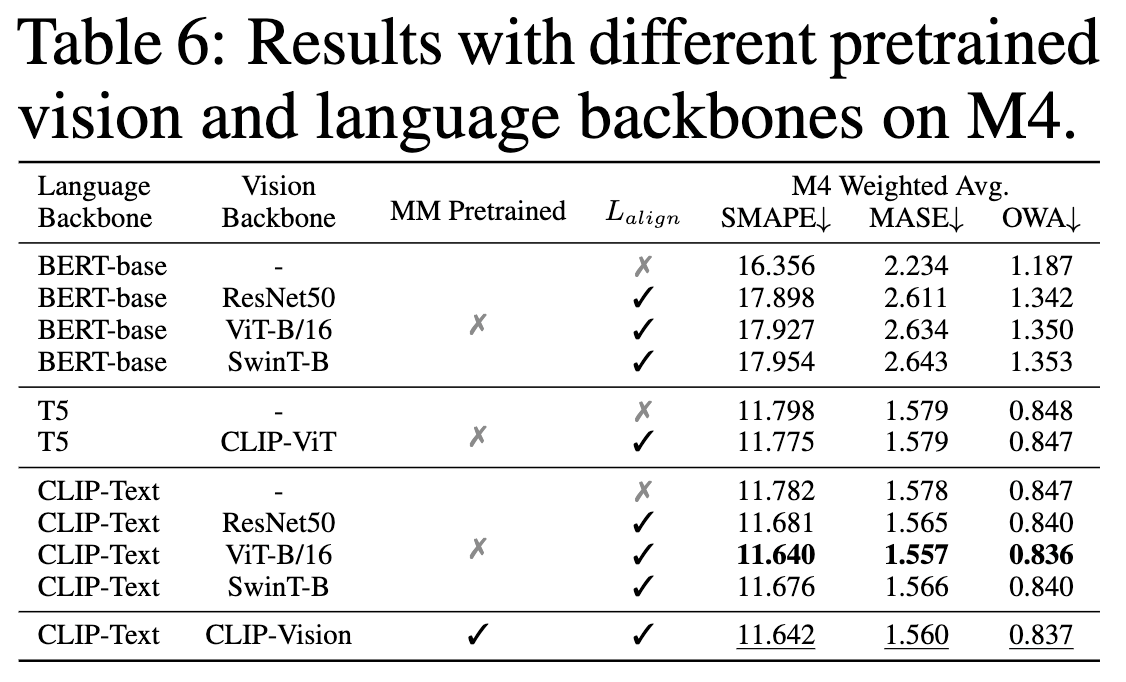
Figure 7: Multimodal backbone ablation study
@article{sixun2025teaching,
  title={Teaching Time Series to See and Speak: Forecasting with Aligned Visual and Textual Perspectives},
  author={Sixun, Dong and Wei, Fan and Wu, Teresa and Yanjie, Fu},
  journal={arXiv preprint arXiv:2506.24124},
  year={2025}
}We thank the CLIP team at OpenAI for their foundational vision-language model that inspired this work. We also appreciate the time series forecasting community for providing comprehensive benchmarks and baseline implementations.
Special thanks to our collaborators and reviewers for their valuable feedback and suggestions that helped improve this research.
This work was supported by Arizona State University. We acknowledge the computational resources provided by our institutions.
Have questions about our method or want to discuss the results? We welcome all questions, discussions, and constructive feedback!
Found issues with our implementation or have suggestions for improvements? Please open an issue on our GitHub repository.
Interested in collaborating or extending this work? We're always open to new research partnerships and joint projects.
Contact us: sdong46@asu.edu
GitHub Issues: TimesCLIP Issues